Thursday, November 29, 2012

electronic money grid and ma's shop


the electronic payment grid cartel
 is nailing the petty merchants and service providers
 to their clever incentive plan  ceiling rates

Q III :record corporate profits !!!!!

Source: Bureau of Economic Analysis via Haver Analytics.
Source: Bureau of Economic Analysis, via Haver Analytics. Source: Bureau of Economic Analysis, via Haver Analytics.

tales of state boundary dynamics a serach for optimal size ? .... "the optimal size of a country is determined by a cost-benefit trade-off between the benefits of size and the costs of heterogeneity" ....OR.....

"Consider two nations, each claiming the same piece of territory. Each may try to gain its ends by force, threats, or offers of payment or exchange. It seems reasonable to suppose that the outcome will be efficient, that the territory will end in the control of the nation willing to pay the higher price. The alternative conjecture would be that the stronger nation will usually be the winner, since it can, if necessary, annihilate the other. Under circumstances of total war, this is doubtless true. But in a world of many nations, the winner of a war of annihilation, although better off than the loser, may be seriously disadvantaged with regard to all other nations. The use of such tactics is then unprofitable and the threat of them implausible. So it seems reasonable to suppose that what determines the winner is not the total resources possessed by each nation but the resources each nation is willing to spend to gain its end and that this will correspond roughly to the value of the end.

Territory may be of value to a nation for many reasons of strategy, sentiment, politics, or economics. We will assume that the reason of chief importance for the phenomena we wish to explore is economic. More specifically, we assume that the value to a nation of any territory is the increase in tax collections made possible by control of that territory, net of collection costs.

We further assume that there have been, in most places at most times, net diseconomies of scale in collection costs. This seems plausible, especially prior to the invention of such aids to bureaucracy as the printing press and the telegraph.

It follows from the foregoing that the size and shape of nations will be such as to maximize their joint potential net revenue and will approach from below the size which would maximize their potential gross revenue.[1]

Lastly, we assume that changes in the diseconomies of scale in the cost of collecting taxes are sufficiently small compared with changes in the economies of scale in amount collected that the latter largely determine changes in the size and shape of nations.

Before we try to apply this theory, several comments are in order. First, we make no assumption about how transfers of territory actually take place--whether the "loser" peacefully relinquishes his claim when it is clear he will be outspent or whether both nations must pay a price, in blood and treasure, to decide the issue. We merely assume that, in the long run, the territory ends in the possession of the nation willing to pay the higher price. Second, we do not assume that nations actually extract the highest possible taxes from their territories, new or old. It could be argued that, where they do not, it must be because they receive an even higher income in some other form from their restraint, but we will not explore that question.[2] We merely assume that having territory and taxing it to the limit is more attractive to a government than not having it at all and that a government is therefore willing, if necessary, to spend in acquiring territory up to the anticipated new revenues it could extract from the acquisition.

We will find it of interest to consider three different taxes and the effects they have on the size of nations--taxes on land, taxes on trade, and taxes on labor. In classifying taxes, we are concerned not with the form of the tax but with what factor actually ends up paying it; a tax on the export of grain, for example, may in fact be paid by a reduction in rents on land.

Since our argument forces us to consider potential taxes, the existence of actual taxes is of interest only as proof that those particular taxes could be collected. The absence of other taxes may suggest that they could not be collected, but potential taxes are defined not by what was collected but by what resources were available to be seized by the state and at what cost. The terms "nation" and "state" are imprecise, especially when applied to a variety of historical periods. Since our theory will rest on the economies of tax collection that result from coordination, we define a t-nation as the largest political unit within which tax policy is effectively coordinated. A feudal kingdom some of whose feudatories independently set tolls across their domains would be composed of several t-nations. A weak nation whose tax policies were dictated by a powerful neighbor would not be a t-nation, nor would any one of several nations that coordinated tax policies for mutual benefit. A Zollverein is a single t-nation with respect to customs, but its members may be separate t-nations with regard to other taxes.

This last example brings out an ambiguity in our definition. What is or is not a t-nation sometimes depends on the particular tax considered. There is a further ambiguity in the phrase "effectively coordinating" which we will for the moment ignore.

For the collection of taxes on trade, there exist economies of scale (in revenue, not in collection costs) up to the length of a single trade route or the width of a network of parallel trade routes. The reason is that several t-nations along a single trade route, each setting its tax rates to maximize its own income, will have a combined rate above their joint optimum. Similarly, several t-nations sitting on parallel trade routes (routes running between the same two points by different paths) will have tax rates below their joint optimum. In either case, total revenues could be increased by combining several t-nations into one.

For the collection of taxes on land, there seem to be no similar effects. A state, whatever its size, can tax up to the full economic rent of land and no more.[3] Taxes on labor present a more complicated picture but one in some ways similar to the case of parallel trade routes. In that case, each nation has an incentive to undertax, in order to increase the trade along its route at the expense of its neighbors. Similarly, where several nations tax a mobile labor force, each is limited in its tax rates by the fear of losing population to the others.[4] One way to raise the cost of emigration is to make a nation larger. Another is to restrict mobility forcibly--to chain the serf to the land[5] or line the border with barbed wire. Since the ratio of border to area declines with increasing size, this again gives an efficiency advantage to larger nations.

Another strategy, and one which avoids the administrative diseconomies of larger nations, is to shape national boundaries in such a way as to make emigration prohibitively expensive. If all the places you want to live--all the places where people speak your language and share your culture--are in one t-nation, emigration, even to escape high taxes, may seem unattractive. "

Some Preliminary Tests of the Theory


To test our theory, we must identify t-nations; that might best be done by carefully examining the political and diplomatic history of every nation in the area we are considering, in order to determine which were single t-nations, which were made up of several t-nations, and which were component parts of larger t-nations. Such a study would be beyond the scope of this paper. Instead, I used the following rules:

1. Anything identified as a state in the standard historical atlases[13] was assumed to be a t-nation except for the Holy Roman Empire after 911 and France from 987 until 1400. In these two cases, the component states or major feudatories were considered t-nations for taxes on trade.[14] Zollvereinen were also considered t-nations for taxes on trade.
2. Where more than one state was under a single ruler, the group of states was considered a single t-nation (this includes states under the church).
A second problem is the paucity of economic and demographic data for the periods we wish to study. This was dealt with by a variety of simplifying assumptions which will be described.

Given the difficulties of testing our theory and the limited scope of this paper, I prefer to regard this section as a preliminary set of tests, designed more to show how the theory might be tested than to confirm or refute it conclusively.

Taxes on Trade

If our arguments are correct, t-nations should tend to shape themselves so as to maximize the total revenues received from taxes on trade, and that tendency should be greater as the amount of trade available to be taxed is greater. We do not expect to observe a perfectly efficient outcome, partly because our information with respect to both trade routes and political boundaries (of t-nations) is imperfect but also, more importantly, because shaping nations to maximize tax revenue from trade is costly. We do expect that the larger the amount of trade, the higher the cost a nation is willing to bear in order to tax it more efficiently and so, ceteris paribus, the higher the tax-efficiency index (TEI). Whether the relevant variable is the absolute value of trade or its value relative to other sources of revenue is somewhat unclear in our model. To the extent that the costs of shaping a t-nation to tax trade efficiently are independent of its total revenue and of that of other t-nations, it is the absolute value of trade which is relevant; to the extent that the costs are proportional to total revenues (either because they involve administrative costs which increase with increasing volume of government or because they involve the costs of conflicts with neighboring states), it is the relative value of trade in relation to the value of other revenue sources.

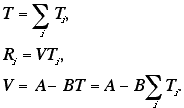
To construct an index of tax efficiency, I assumed that trade declines linearly with total taxes on the trade route. Let the total volume of trade along a single trade route be V, the number of nations taxing the route be n, the tax rate of the ith nation be TI , and the total tax rate along the route T. We have


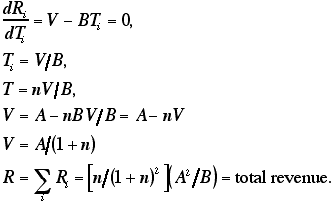
By definition, t-nations maximize independently. So nation i sets TI to maximize its revenue, RI:


So we see that, where n nations control a single trade route, the total revenue collected will be proportional to n/(n + i)2. When two nations each control one of two parallel trade routes between the same two points, the assumption of independence implies that they will collect no taxes at all; as in the familiar case of perfect competition, all profits are competed away. We compute our TEI, for a given political map and a given set of trade routes (see figs. 1 and 2), by calculating the total tax collected under these assumptions and dividing it by the total tax that would have been collected had each trade route been controlled by a single t-nation.

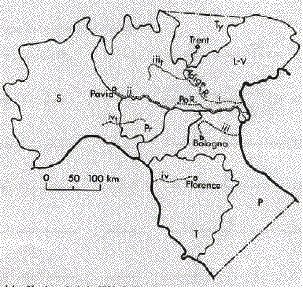
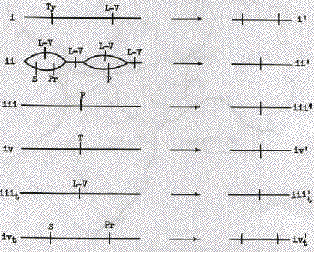
Consider, for example, the trade route labeled i on figure 1A, which follows the Adige River from Trent to the Adriatic. It goes through the territory of two nations, as shown by its diagram on figure 2A. So n is 2, the total tax revenue that would be collected is (2/9)(A2/B), the total tax collected by a single revenue-maximizing state controlling the same route would be (1/4) (A2/B), so the TEI for that particular route is 8/9.

Now consider route ii on figure 1A, running along the Po from Pavia to the Adriatic. Here, as in all our calculations, we assume that a nation must control both banks of a river at one point in order to control commerce passing along the river at that point. Since for most of the route the two banks of the river are controlled by different nations, one has in effect two parallel routes, one controlled by Lombardy-Venetia and one by Sardinia and then by Parma. The routes join into one where the river flows through Lombard-Venetian territory, then separate again where it becomes the border between Lombardy-Venetia and the Papal States. Finally it flows again through Lombard-Venetian territory to the Adriatic. The situation is diagrammed in figure 2A. Since parallel routes under our assumptions produce no revenue, we may remove the parallel segments, yielding diagram ii' of figure 2A. We see that, in spite of the complication of the original diagram, only one nation (Lombardy- Venetia) is in a position to tax the trade route. No boat without permission from the Lombard-Venetian authorities may travel from Pavia to the sea; any boat having such permission may, without permission from any other nation, simply by keeping to the left bank of the Po. So n is 1, and the TEI for this route is unity. The TEIs calculated from figures 2A and 2B are shown in table 1.


Fig. 1A.--Northern Italy in 1854.

S: Kingdom of Sardinia; LV: Lombardy-Venetia; Ty: Tyrol; Pr: Parma; P: Papal States; T: Tuscany.


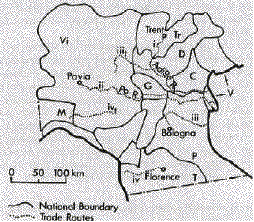
Fig. 1B.--Northern Italy in 1378. Vi: domains of the Visconti; M: Marquisate of Montferrat; C: Gonzaga; Tr: Bishopric of Trent; D : Della Scala dominions; C: Carrara; V: Venetian Republic; P: Papal States; T: Tuscany. (Tr and P are parts of the same t-nation.)


Fig. 2A.--Schematic diagrams of trade routes, northern Italy, 1854
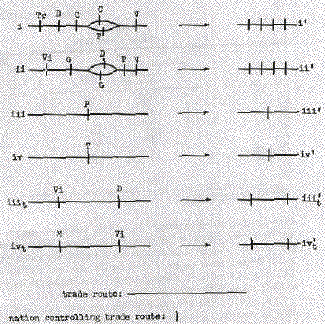

To construct our trade routes, we utilized the fact that water transport was until the nineteenth century very much cheaper than land transport.[15] Our first set of trade routes was constructed by finding, on an economic map of Europe in 1500 (Putzger 1965, pp. 70-71), all cities of over 20,000 people and connecting them to the sea by any available navigable rivers.[16] Routes iii and iv on figures 1A and 1B are examples. All routes were assumed to have the same amount of trade, save that those from cities of over 50,000 were treated as having twice the trade of the others. The TEI was calculated for each city's trade routes and the results averaged, with the large cities being counted twice. The efficiency indices calculated from these trade routes are shown in the first row of table 2.

Fig. 2B--Schematic diagrams of trade routes, northern Italy, 1378


It may be objected that, by using a single set of trade routes for all times, we ignore the possibility that economic change may have altered the pattern of trade. But if we recalculate the trade routes at each period, we run the risk that a high or rising TEI may reflect trade routes adapting themselves to the shape of nations rather than the other way around. By calculating trade routes on the basis of early data, we at least guarantee that, if the TEI rises after the medieval period, as we expect, it will do so in spite of, not because of, the imperfections of our method.

The larger nations are, the fewer of them a trade route will on average go through. So a high TEI might be merely a side effect of some other factor that made nations large. To eliminate such effects and determine to what extent t-nations actually shaped themselves to trade routes, I constructed a second set of "trade routes" very similar to the first, save that there was no reason to expect any trade on them. They were constructed by translating each real trade route by 100 kilometers in each of two orthogonal directions.[17] Routes iiit and ivt on figures 1A and 1B are the routes corresponding to iii and iv. These imaginary trade routes provided the control; I calculated the tax-efficiency index for them just as for the real trade routes. I then divided the real TEI by the control TEI, to give a measure of the degree to which nations shaped themselves to trade routes. The results are shown in line 2 of table 2.


TABLE 1
Trade Route TEI's

1378
1854
Route
n
TEI
n
TEI
i
4
4/25
16/25
2
2/9
8/9
ii
4
4/25
16/25
1
1/4
1
iii
1
1/4
1
1
1/4
1
iv
1
1/4
1
1
1/4
1
iiit
2
2/9
8/9
1
1/4
1
ivt
2
2/9
8/9
2
2/9
8/9
...
...
9/8
...
...
18/17
...
...
1
...
...
9/8

* Corresponds to line 2, table 2.

+Corresponds to line 4, table 2.


One defect in this procedure is that our real trade routes are rivers, and our controls are not. Rivers may affect the shape of nations in ways unrelated to our theory (in particular by providing easily defended boundaries), and such effects may distort the results shown on line 2 of table 2.

To avoid this problem, I constructed another set of trade routes and controls. I used the economic map to estimate the relative amount of trade on different rivers. I then selected a group of the highest-trade rivers and paired each with a nearby low-trade river of comparable length; the first set I used as my trade routes, the second as my controls.[18] Route ii on figures 1A and 1B is a high-trade river and route i the corresponding low-trade river. The results are shown on lines 3 and 4 of table 2.


TABLE 2

TEI for Trade

486
741
814
870
Ca. 1000
Ca. 1200
1378
1560
1648
1740
1815
1854
1929
1973
1. Cities

0.995
0.952
...
0.975
0.867
0.889
0.826
...
0.875
0.929
...
0.97
0.969
0.985
2. Cities/cities displaced

1.02
0.952
...
0.995
1.02
1.02
1.07
...
1.05
1.10
...
1
0.988
0.994
3. High-trade rivers
.978
...
1
...
0.903
0.843
0.838
0.88
0.88
0.94
0.963
0.981
0.981
0.981
4. High trade/low trade

1.08
...
1
...
1.08
1.08
1.06
1.08
1.07
1.12
1.11
1.04
1.02
1

The results of these calculations are somewhat mixed. The absolute TEIs behave about as we would expect, reaching their lowest value from about 1,000 to 1,400 and then rising. The relative TEIs are less satisfactory. The values shown in line 2 of table 2 seem to fluctuate almost randomly; those shown in line 4 rise, as one would expect, with increasing trade in the sixteenth, seventeenth, and eighteenth centuries but show no previous dip. Both lines show dips in the second half of the nineteenth century and in the twentieth. One explanation is that, as nations became large, the tax efficiency became high even for a random set of trade routes; a one-nation world, after all, is perfectly tax efficient for any set of routes. Another explanation is that our trade routes were calculated from an economic map for 1500, using an assumption (water transport) designed for a premodern world. The later the date, the less likely it is that our "trade routes" actually carry more trade than our "controls." A third explanation is that the dip reflects the declining relative importance of taxes on trade.

The Effect of Taxes on Labor

According to our arguments, nations should tend to shape themselves so as to include entire linguistic groups within their borders, and the degree to which they do so should be greater as the amount of their revenue derived from taxes on labor is greater. The argument does not necessarily imply that nations will tend toward linguistic homogeneity; a nation containing all of two language groups is not more subject to tax competition than a nation containing all of one (although it may be unnecessarily bearing other diseconomies related to its size). It does imply that linguistic regions will tend to become nationally homogeneous, that one linguistic region will tend to consist only of territory belonging to a single t-nation. To test this conjecture, we calculate the linguistic homogeneity index (LHI), defined as the average over all persons of the percentage of speakers of each person's language who live in the same t-nation as he does. Formally


Where Nij is the number of people in nation i speaking language j. This index, unlike TEI, is not derived from any actual calculation of taxes that will be collected, since we do not have a satisfactory simple model of this kind of tax competition.[19] We expect, however, that the larger the percentage of a citizen's language group living outside his nation, the easier it is for him to migrate and the lower, in consequence, the taxes that can be collected from him.

In order to evaluate the index, one requires a census of the number of speakers of each language in each i-nation. For many of the times at which we wish to evaluate it, no such data exist. I have therefore made several simplifying assumptions. The first is that the linguistic map of nineteenth-century Europe accurately represents linguistic boundaries from the twelfth century to the present. This assumption appears plausible, to judge by the near identity among linguistic maps of central Europe in 1500 and Europe in the nineteenth and twentieth centuries.[20] The second assumption is that the relative populations of linguistic regions have stayed the same over the same period.[21] The third is that the population of each linguistic region at every time is uniformly distributed over the region. It would be possible, but laborious, to improve on these assumptions by the use of such historical data on population as are available.

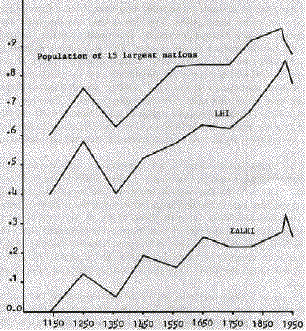
Of the unrealistic elements in our assumptions, only one seems likely to effect qualitative results. Our linguistic map differentiates only crudely among dialects.[22] At the earliest times we are considering, variations among dialects were many and large; even today the difference between, say, Austrian and Swiss German (both of which are here classified as High German) is substantial. I may have underestimated the LHI for the earliest periods by ignoring differences between dialects that were at that time virtually separate languages. Using these assumptions, I calculated values for LHI. They are shown on line 1 of table 3 and in figure 3.

Here, as with taxes on trade, we would like to separate out the effects of changes in the size of nations from changes in their shapes. To do this, we select matched groups of countries at adjacent dates, by the following procedure.

First, for each pair of adjacent dates (1250 and 1360, e.g.), we calculate the combined population (measured as a fraction of the combined population of all nations)[23] of the 15 largest nations (by population).


Fig. 3


This is shown on line 2 of table 3 and graphed as line 2 of figure 3. Since the figure for 1250 is larger than for 1360, we proceed to choose a group of 15 nations in 1250 whose combined population is the same as that of the 15 largest nations in 1360. Our choice rule is to order the nations by size, remove a consecutive sequence of n nations, calculate the combined population of the 15 largest nations remaining, and compare it with the population we are trying to match. We start with n = 0 and continue until we have a match to within 2 percent; if the same value of n generates two different groups that match to within 2 percent, we take the closer match.


Having chosen our groups of 15 nations (the 15 largest in 1360 and a matching group of 15 in 1250), we calculate the LHI for each group. Their difference is shown as LHI on line 3 of table 3. It is a measure of the change in LHI from one date to the next caused by changes in the shapes of nations, independent of changes in their sizes. The sum of LHIs from 1140 on is shown on line 4 of table 3 and graphed in figure 3; it represents the cumulative change in linguistic homogeneity controlling for changes in nation size.


TABLE 3
LHI VALUES BY YEARS

1140
1250
1360
1450
1560
1648
1740
1815
1914
1922
1950
1. LHI

.40
.58
.40
.52
.57
.63
.62
.68
.81
.85
.77
2. Population of 15 largest nations*

.60
.76
.63
.71
.83
.84
.84
.92
.96
.92
.87
3. LHI
+.13
+.14
+.1
0.0
+.06


-.08
-.04
-.03
+.05
-.08
4. LHI

0
.13
.05
.19
.15
.25
.22
.22
.27
.33
.25


*as a fraction of total for all countries.


The results of our calculations appear to fit reasonably well our expectation that the LHI should increase whenever income, as a potential source of tax revenue, increases relative to trade and rent. The upper two curves of figure 3 have two sections of sustained growth; one follows the Great Plague, the other parallels the Industrial Revolution. The lower curve has its largest single rise in the century after the plague and rises also through the nineteenth and early twentieth centuries, but the rest of the pattern is less clear. All three curves decline sharply during the last period (1922-50). While our theory can explain this decline as the result of a shift from one method of preventing exit to another, it does not predict it.

According to our theory, a high LHI reflects one way in which a nation prevents its taxpayers from emigrating. Nations which prohibit exit by force should have less incentive to take advantage of linguistic barriers; a Hungarian who is prepared to crawl across barbed wire into Austria is not likely to be deterred by the need to learn a new language once he arrives. So iron curtain countries should tend to have a lower LHI than other similar countries. To test this conjecture, I calculated the LHI for the iron curtain countries in 1950 and for a group of non-iron curtain countries containing the same number of countries and the same total population. The iron curtain countries, as shown in table 4, had a lower value of the index. In order to check whether this reflected anything more than differences in the linguistic distributions of eastern and western Europe, I made a similar calculation for the same areas in 1922. The western countries still had a higher value of the index, but the difference was less than half as great. While I would not like to claim very much significance for the results, it is at least encouraging that they fit our theory.

I would say much the same about the results of all the tests described in this paper. Although some specific features do not fit our expectations, the results tend on the whole more to confirm than to contradict our theory. I will be happy if they convince those better qualified in economic and political history not that our theory is true but that it is worth the effort required to test it further.


Table 4
LHIs for Iron Curtain and Non-Iron Curtain Countries


1950 Iron curtain

1950 Non-Iron Curtain*

1922 "Iron Curtain"**
1922 "Non-Iron Curtain * ***
1 2
LHI .81 .88 .78 .81 .81
Population§ .38 .38 .32 .32 .32

*A selection containing same number of countries and same total population as the iron curtain countries. http://www.daviddfriedman.com/Academic/Size_of_Nations/Size_of_Nations.html

Wednesday, November 28, 2012

noah smith is as useless as three tits on a yule log

here 's a why so:


"Bob Lucas on macro "


"I find Bob Lucas more intriguing than any other economist of the last few decades. I'm always interested to read what he has to say, for example in this recent interview (hat tip to Steve Williamson). Some excerpts, and my quick reactions follow. Here's Lucas on the Lucas Critique:
[T]he term "Lucas critique" has survived, long after [the] original context has disappeared. It has a life of its own and means different things to different people. Sometimes it is used like a cross you are supposed to use to hold off vampires: Just waving it it an opponent defeats him. Too much of this, no matter what side you are on, becomes just name calling.
This is basically what I was conjecturing in this blog post. Of course Lucas gets to say it more matter-of-factly, because...well, his name is on the Critique. Anyway, here's Lucas on DSGE modeling:
Virtually all macroeconomic models today are dynamic, stochastic and general equilibrium (where here "general equilibrium" means you have the same number of equations and unknowns)...If we narrow the definition of DSGE by using "general equilibrium" to refer to competitive or Nash equilibria where the strategy sets of each agent are made explicit in an internally consistent way then we have Kydland-Prescott and other RBC descendants and not much else.
This is interesting, for several reasons. One is that Lucas expands the definition of "general equilibrium" to include Nash equilibria, which is not the way I've ever seen it done; I have always understood the term "general equilibrium" to be synonymous with "Walrasian equilibrium".

Also, it's interesting that Lucas says that RBC models are essentially the only equilibrium models (of the business cycle, presumably) in which "the strategy sets of each agent are made explicit in an internally consistent way". Is this true? I don't think it is true. For example, take a Calvo model. In a Calvo, model, agents' ability to set prices is restricted by a mysterious, exogenous "Calvo Fairy"...but, given the existence of such a "Fairy", the strategy sets of agents in the model are quite explicit and quite internally consistent. In a Prescott-type RBC model, agents' decisions are constrained by exogenous "technology"; you might think that this is more plausible of an assumption than a "Calvo Fairy", but in terms of its effect on the internal consistency of the strategy sets of the agents in the model, it seems no different.

Or maybe I'm reading Lucas wrong here?

Lucas on the causes of business cycles:
I was [initially] convinced by Friedman and Schwartz that the 1929-33 down turn was induced by monetary factors...I concluded that a good starting point for theory would be the working hypothesis that all depressions are mainly monetary in origin. Ed Prescott was skeptical about this strategy from the beginning...
I now believe that the evidence on post-war recessions (up to but not including the one we are now in) overwhelmingly supports the dominant importance of real shocks. But I remain convinced of the importance of financial shocks in the 1930s and the years after 2008. Of course, this means I have to renounce the view that business cycles are all alike!
In 1980, Lucas had written:
If the Depression continues, in some respects, to defy explanation by existing economic analysis (as I believe it does), perhaps it is gradually succumbing under the Law of Large Numbers.
But with the post-2008 recession looking so similar to the Depression, it seems to have become clear to Lucas that the Law of Large Numbers will no longer do the trick. There must in fact be two types of recessions, with one (more frequent, less severe) type caused by "real shocks", and the other (rarer, more severe) type caused by "financial shocks".
That Lucas has now twice changed his ideas about the underlying causes of the business cycle - the most important question in all of business cycle theory - is in my opinion a reason to admire him. When the facts change, Lucas changes his mind, as any scientist should.

Incidentally, the idea that "financial shock" recessions are different would tend to put Lucas more on the Reinhart-Rogoff side of things. Though Lucas doesn't mention here whether he thinks financial-shock recessions should last longer.

But the fact that history can cause even the smartest of macroeconomists to change his mind about the fundamental question of his field not once, but twice over the course of his lifetime is a stark illustration of the poverty of data that business-cycle theorists have to work with. In a sense, all we can do is watch history go by and hope it repeats itself enough for us to get a handle on what's happening.

Finally, Lucas on microfoundations:
The "[micro]foundations" of...models don't guarantee empirical success or policy usefulness.
What is important...is that if a model is formulated so that its parameters are economically-interpretable they will have implications for many different data sets. An aggregate theory of consumption and income movements over time should be consistent with cross-section and panel evidence...An estimate of risk aversion should fit the wide variety of situations involving uncertainty that we can observe...Estimates of labor supply should be consistent aggregate employment movements over time as well as cross-section, panel, and lifecycle evidence...This kind of cross-validation (or invalidation!) is only possible with models that have clear underlying economics: micro-foundations, if you like.
This is bread-and-butter stuff in the hard sciences.
This I completely and utterly agree with. The power of microfoundations is that they allow unification. They give you the hope of explaining many phenomena in terms of one underlying phenomenon. In fact, there really should be no conceptual difference between the terms "microfoundations" and "unification". Microfounded models - when they work -are inherently more useful and powerful than equivalent "ad-hoc" models.

Of course, as Lucas points out, this makes microfounded models inherently more vulnerable to falsification than other models. An "ad-hoc" non-microfounded model only has to explain one thing, but a microfounded model has to explain many things. This means that as soon as the microfounded model fails to explain any one of the things it purports to explain, you have to conclude that the model is flawed, and look for a better model. (In practice of course, not everyone actually does this when they ought to...)

Anyway, it's always valuable and fascinating to read Lucas' thoughts. I seem to agree with him on quite a number of important things, though not on issues related to the assumptions or the value of the RBC modeling paradigm...Not that many people especially care whether I agree with Bob Lucas, mind you, but hey, it's my blog!"

Tuesday, November 27, 2012

sailor bob solow comes at us again thru the market fetishers solitary blow hole

"Since knowledge

—about technological possibilities,
 about citizens’ preferences,
about the interconnections of these,
 about still more—

is inevitably and thoroughly decentralized,

 the centralization of decisions is bound to generate errors and then fail to correct them.


 The consequences for society can be calamitous,
 as the history of central planning confirms.

That is where markets come in."


 "All economists know
                            a system of competitive markets
 is a remarkably efficient way
                         to aggregate all that knowledge
 while preserving decentralization "


---------------------------------------


 "it would be perverse to read the history, as of 1944 or as of now,
 as suggesting that the standard regulatory interventions in the economy have any inherent tendency to snowball into “serfdom.” The correlations often run the other way."

superbly apposite

butviniki

" Sixty-five years later, Hayek’s implicit prediction is a failure,
  rather like Marx’s forecast of the coming “immiserization of the working class.”

whoops

why the recent history suggests marx  had  a hold of something there

the"earnings of our  bottom half  are  shrinking and have been shrinking
on and off
              for thirty years

"the share of total income accruing to the bottom 50% fell to 11.7 percent in 2010 from 14.4% in 2001."

hark back to the good old inflation days in nippon


Chart – historic CPI inflation Japan (yearly basis) – full term

Chart - historic CPI inflation Japan - long term inflation development


ahh the post bretton woods 70's

when japan conquered the world markets
and ran quite an inflation  temperature doing it

where and how i waste away my solitary internet hours ...an exem-plum


no not  down there to the lower right on all fours.... alas


here

 at
Economist's View
run by this chap


and i waste  this way.....in the cages below this bit of pk piffling

among a bevy of my peers

tapping away for ever in a certain  limbo  on the installment plan


------------------------------------------------------------------------------

mark intones:

The deficit scolds have been wrong again and again:

comes krugman...

Fighting Fiscal Phantoms, by Paul Krugman, Commentary, NY Times: These are difficult times for the deficit scolds who have dominated policy discussion for almost three years. One could almost feel sorry for them, if it weren’t for their role in diverting attention from the ongoing problem of inadequate recovery, and thereby helping to perpetuate catastrophically high unemployment.
What has changed? For one thing, the crisis they predicted keeps not happening. Far from fleeing U.S. debt, investors have continued to pile in, drivinginterest rates to historical lows. Beyond that, suddenly the clear and present danger to the American economy isn’t that we’ll fail to reduce the deficit enough; it is, instead, that we’ll reduce the deficit too much. ...
Given these realities, the deficit-scold movement has lost some of its clout. ... But the deficit scolds aren’t giving up. Now yet another organization,Fix the Debt, is campaigning for cuts to Social Security and Medicare, even while making lower tax rates a “core principle.” That last part makes no sense in terms of the group’s ostensible mission, but makes perfect sense if you look at the array of big corporations, from Goldman Sachs to the UnitedHealth Group, that are involved in the effort and would benefit from tax cuts. Hey, sacrifice is for the little people.
So should we take this latest push seriously? No... As far as I can tell, every example supposedly illustrating the dangers of debt involves either a country that, like Greece today, lacked its own currency, or a country that, like Asian economies in the 1990s, had large debts in foreign currencies. Countries with large debts in their own currency, likeFrance after World War I, have sometimes experienced big loss-of-confidence drops in the value of their currency — but nothing like the debt-induced recession we’re being told to fear.
So let’s step back for a minute, and consider what’s going on here. For years, deficit scolds have held Washington in thrall with warnings of an imminent debt crisis, even though investors, who continue to buy U.S. bonds, clearly believe that such a crisis won’t happen; economic analysis says that such a crisis can’t happen; and the historical record shows no examples bearing any resemblance to our current situation in which such a crisis actually did happen.
If you ask me, it’s time for Washington to stop worrying about this phantom menace — and to stop listening to the people who have been peddling this scare story in an attempt to get their way.