- From elementary probabilityIn fact, the left hand side can be much larger than the right hand side but it is the quantity on the right hand side that we control with hypothesis testing.
- Bias. There are many biases in studies so even if the null hypothesis is true, the p-value will not have a Uniform (0,1) distribution. This leads to extra false rejections. There are too many sources of potential bias to list but common ones include: unobserved confounding variables and the tendency to only report studies with small p-values.
Let me be clear about this: I am not suggesting we should treat every scientific problem as if it is a hypothesis testing problem. And if you have reason to include prior information into an analysis then by all means do so. But unless you have magic powers, simply doing a Bayesian analysis isn’t going to solve the problems above.
Let’s compute the probability of a false finding given that a paper is published. To do so, we will make numerous simplifying assumptions. Imagine we have a stream of studies. In each study, there are only two hypotheses, the null
The bias problem is indeed serious. It infects any analysis you might do: tests, confidence intervals, Bayesian inference, or whatever your favorite method is. Bias transcends arguments about the choice of statistical methods.
Which brings me to Madigan. David Madigan and his co-workers have spent years doing sensitivity analyses on observational studies. This has been a huge effort involving many people and a lot of work.
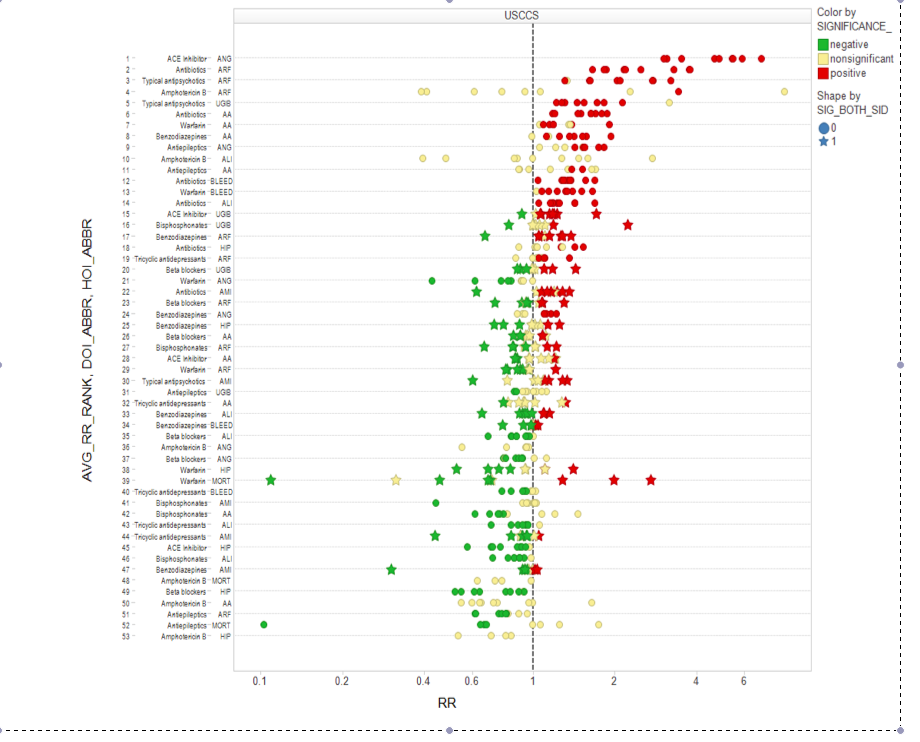
They considered numerous studies and asked: what happens if we tweak the database, the study design, etc.? The results, although not surprising, are disturbing. The estimates of the effects vary wildly. And this only accounts for a small amount of the biases that can enter a study.
I do not have links to David’s papers (most are still in review) so I can’t show you all the pictures but here is one screenshot:

Each horizontal line is one study; the dots show how the estimates change as one design variable is tweaked. This picture is just the tip of the iceberg. (It would be interesting to see if the type of sensitivity analysis proposed by Paul Rosenbaum is able to reveal the sensitivity of studies but it’s not clear if that will do the job.)
To summarize: many published findings are indeed false. But don’t blame this on significance testing, frequentist inference or incompetent epidemiologists. If anything, it is bias. But really, it is simply a fact. The cure is to educate people (and especially the press) that just because a finding is published doesn’t mean it’s true. And I think that the sensitivity analysis being developed by David Madigan and his colleagues will turn out to be essential.